Flume在大数据集群下的配置以及监控工具Ganglia的部署安装
前提:需要有三台虚拟机(hadoop102,103,104)配置好相关基础环境
安装
将安装包上传到/opt/software中
tar -zxf /opt/software/apache-flume-1.9.0-bin.tar.gz -C /opt/module/
修改 apache-flume-1.9.0-bin 的名称为 flume
mv /opt/module/apache-flume-1.9.0-bin /opt/module/flume
将 lib 文件夹下的 guava-11.0.2.jar 删除以兼容 Hadoop 3.1.3
rm /opt/module/flume/lib/guava-11.0.2.jar
注意:需要保证java环境已经配置成功。
案例测试
我们可以通过一个案例来测试一下flume的运行情况。
需求:使用 Flume 监听一个端口,收集该端口数据,并打印到控制台。
安装 netcat 工具
sudo yum install -y nc
判断 44444 端口是否被占用
sudo netstat -nlp | grep 44444
在 flume 目录下创建 job 文件夹并进入 job 文件夹。
mkdir job
cd job
在 job 文件夹下创建 Flume Agent 配置文件 flume-netcat-logger.conf。
vim flume-netcat-logger.conf
在 flume-netcat-logger.conf 文件中添加如下内容。
添加内容如下:
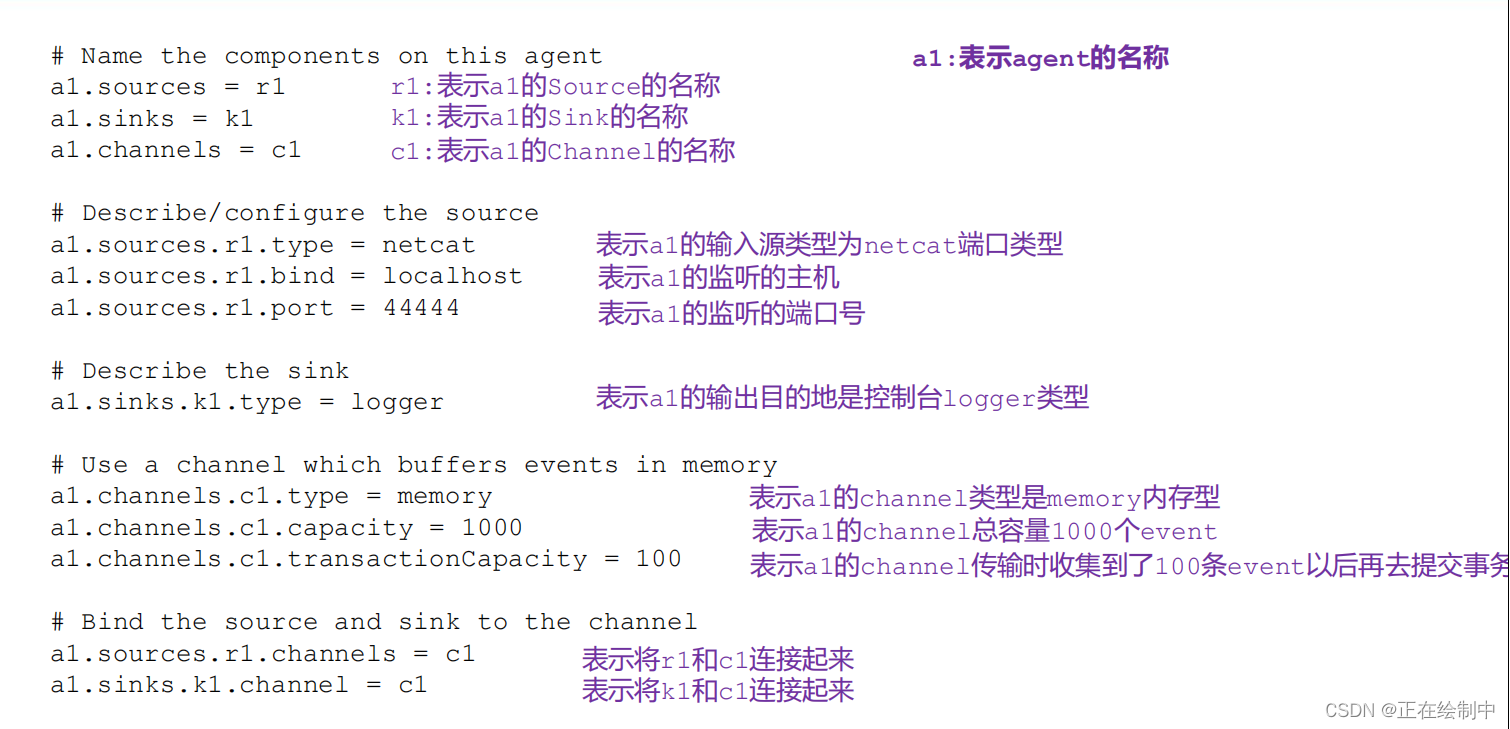
# Name the components on this agent

a1.sources = r1

a1.sinks = k1

a1.channels = c1

# Describe/configure the source

a1.sources.r1.type = netcat

a1.sources.r1.bind = localhost

a1.sources.r1.port = 44444
# Describe the sink

a1.sinks.k1.type = logger

# Use a channel which buffers events in memory

a1.channels.c1.type = memory

a1.channels.c1.capacity = 1000

a1.channels.c1.transactionCapacity = 100

# Bind the source and sink to the channel

a1.sources.r1.channels = c1

a1.sinks.k1.channel = c1
注:配置文件来源于官方手册 http://flume.apache.org/FlumeUserGuide.html
配置参数解释:
先开启flume监听端口。
第一种写法
bin/flume-ng agent --conf conf/ --name a1 --conf-file job/flume-netcat-logger.conf -Dflume.root.logger=INFO,console
第二种写法
bin/flume-ng agent -c conf/ -n a1 -f job/flume-netcat-logger.conf -Dflume.root.logger=INFO,console
参数说明:
–conf/-c:表示配置文件存储在 conf/目录
–name/-n:表示给 agent 起名为 a1
–conf-file/-f:flume 本次启动读取的配置文件是在 job 文件夹下的 flume-telnet.conf文件。
-Dflume.root.logger=INFO,console :-D 表示 flume 运行时动态修改 flume.root.logger参数属性值,并将控制台日志打印级别设置为 INFO 级别。日志级别包括:log、info、warn、error。
使用 netcat 工具向本机的 44444 端口发送内容
nc localhost 44444
在 Flume 监听页面观察接收数据情况。注意到输出内容后flume可以监听到并且正常显示没有报错,我们的配置以及这个案例也就成功了。
Flume数据流监控
Ganglia 的安装与部署
Ganglia 由 gmond、gmetad 和 gweb 三部分组成。
gmond(Ganglia Monitoring Daemon)是一种轻量级服务,安装在每台需要收集指标数据的节点主机上。使用 gmond,你可以很容易收集很多系统指标数据,如 CPU、内存、磁盘、网络和活跃进程的数据等。
gmetad(Ganglia Meta Daemon)整合所有信息,并将其以 RRD 格式存储至磁盘的服务。
gweb(Ganglia Web)Ganglia 可视化工具,gweb 是一种利用浏览器显示 gmetad 所存储数据的 PHP 前端。在 Web 界面中以图表方式展现集群的运行状态下收集的多种不同指标数据。
部署Ganglia
规划
hadoop102: web gmetad gmod

hadoop103: gmod

hadoop104: gmod
在 102 103 104 分别安装 epel-release
sudo yum -y install epel-release
在 102 安装
sudo yum -y install ganglia-gmetad

sudo yum -y install ganglia-web

sudo yum -y install ganglia-gmond
在 103 和 104 安装
sudo yum -y install ganglia-gmond
在 102 修改配置文件/etc/httpd/conf.d/ganglia.conf
sudo vim /etc/httpd/conf.d/ganglia.conf
修改Require ip配置:(注意配的是win主机地址)
# Ganglia monitoring system php web frontend
#
Alias /ganglia /usr/share/ganglia
<Location /ganglia>
 # Require local
 # 通过 windows 访问 ganglia,需要配置 Linux 对应的主机(windows)ip 地址
 Require ip 192.168.10.1
 # Require ip 10.1.2.3
 # Require host example.org
</Location>
在 102 修改配置文件/etc/ganglia/gmetad.conf
sudo vim /etc/ganglia/gmetad.conf
修改为:data_source “my cluster” hadoop102
在 102 103 104 修改配置文件/etc/ganglia/gmond.conf
 sudo vim /etc/ganglia/gmond.conf
修改为:
cluster {
 name = "my cluster"
 owner = "unspecified"
 latlong = "unspecified"
 url = "unspecified"
}
udp_send_channel {
 #bind_hostname = yes # Highly recommended, soon to be default.
 # This option tells gmond to use a source
address
 # that resolves to the machine's hostname.
Without
 # this, the metrics may appear to come from
any
 # interface and the DNS names associated with
 # those IPs will be used to create the RRDs.
 # mcast_join = 239.2.11.71
 # 数据发送给 hadoop102
 host = hadoop102
 port = 8649
 ttl = 1
}
udp_recv_channel {
 # mcast_join = 239.2.11.71
 port = 8649
# 接收来自任意连接的数据
 bind = 0.0.0.0
 retry_bind = true
 # Size of the UDP buffer. If you are handling lots of metrics
you really
 # should bump it up to e.g. 10MB or even higher.
 # buffer = 10485760
}
在 102 修改配置文件/etc/selinux/config
 sudo vim /etc/selinux/config
修改为:
# This file controls the state of SELinux on the system.
# SELINUX= can take one of these three values:
# enforcing - SELinux security policy is enforced.
# permissive - SELinux prints warnings instead of enforcing.
# disabled - No SELinux policy is loaded.
SELINUX=disabled
# SELINUXTYPE= can take one of these two values:
# targeted - Targeted processes are protected,
# mls - Multi Level Security protection.
SELINUXTYPE=targeted
尖叫提示:selinux 生效需要重启,如果此时不想重启,可以临时生效之:
sudo setenforce 0
启动 ganglia
在 102 103 104 启动
sudo systemctl start gmond
在 102 启动
sudo systemctl start httpd
sudo systemctl start gmetad
打开网页浏览 ganglia 页面
http://hadoop102/ganglia
提示:如果完成以上操作依然出现权限不足错误,请修改/var/lib/ganglia 目录的权限:
sudo chmod -R 777 /var/lib/ganglia
注意,修改完权限或配置文件后需要将启动流程重新走一遍,需要先停止进程然后重新再启动
原文地址:https://blog.csdn.net/weixin_73195042/article/details/137964715
免责声明:本站文章内容转载自网络资源,如本站内容侵犯了原著者的合法权益,可联系本站删除。更多内容请关注自学内容网(zxcms.com)!